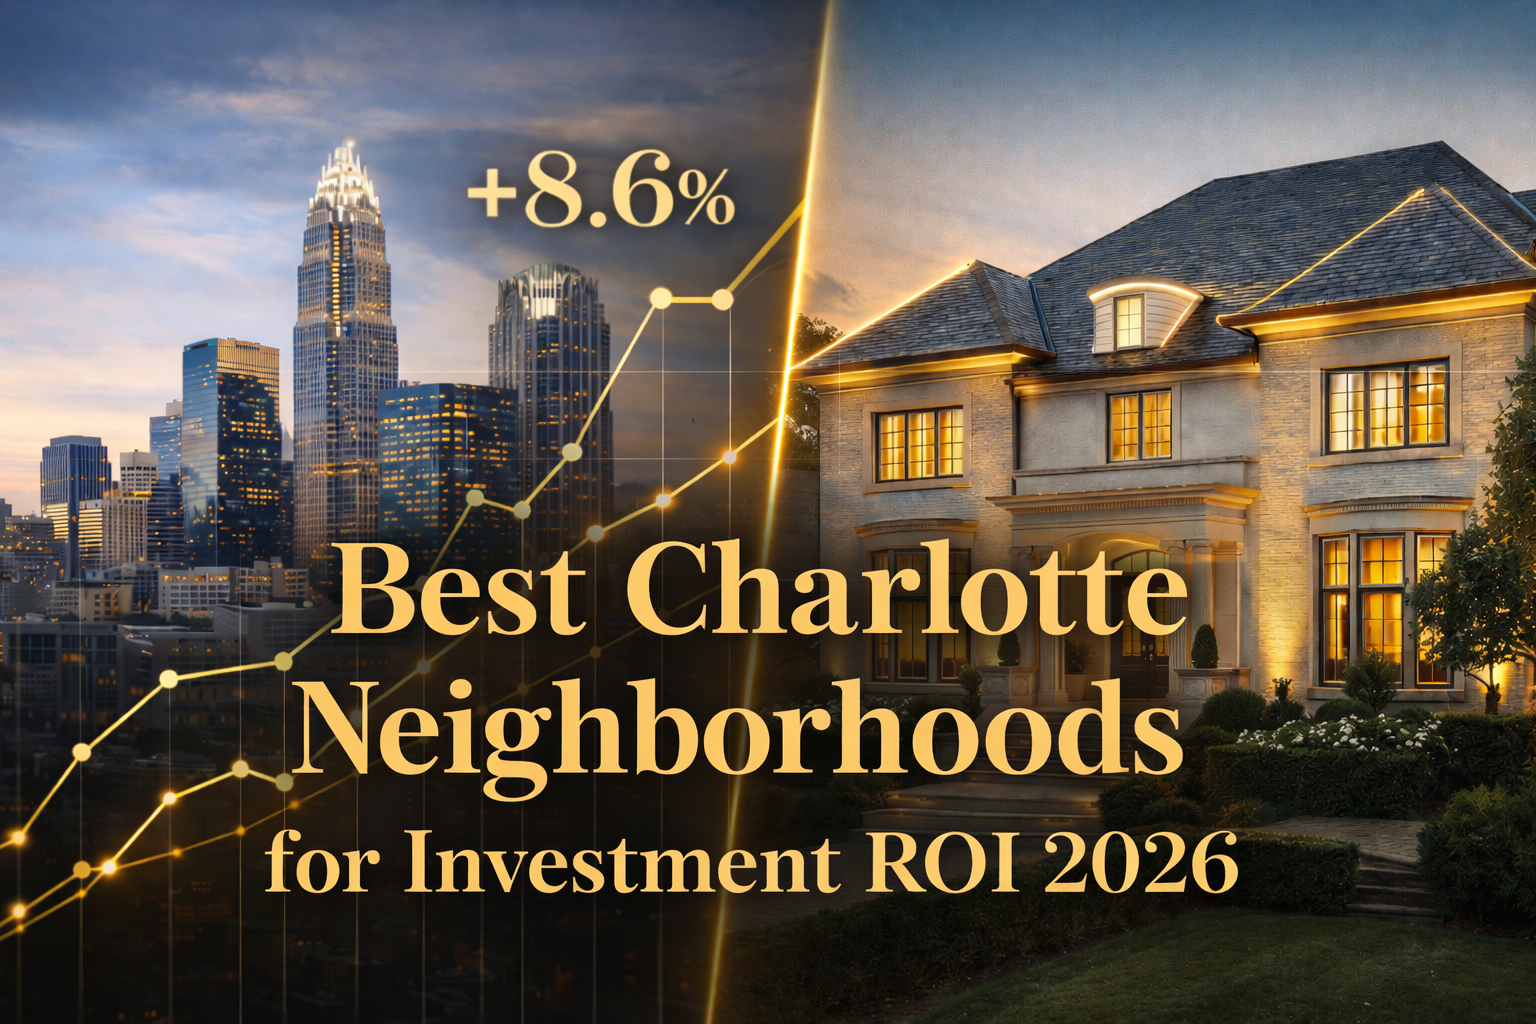
Best Charlotte Neighborhoods for Real Estate ROI (2026)
Last updated: April 14, 2026
EXECUTIVE SUMMARY
- Charlotte's top 2026 investment neighborhoods split by investor profile. Cash-flow buyers: Plaza Midwood, NoDa, Wesley Heights, Optimist Park (cap rates 5.5%–7.8%). Appreciation buyers: South End, Dilworth, Myers Park (5-year appreciation 32%–41%). Hybrid: SouthPark, Elizabeth, lower-tier Foxcroft.
- Cap rate benchmarks for Charlotte 2026: 6.5%–7.8% emerging urban (Optimist Park, LoSo, Wesley Heights); 5.0%–6.5% established urban (Plaza Midwood, NoDa); 3.5%–4.8% luxury long-term rental; below 3.5% = trophy asset, not cash flow play.
- Short-term rentals deliver 1.5x–2.2x gross yield in the right submarket — South End, Plaza Midwood, Uptown, NoDa. Charlotte's ordinance requires registration and imposes zone-specific limits. Lake Norman waterfront is the premier STR luxury play at $4,500–$12,000/week peak.
- 5-year neighborhood appreciation leaders: South End +41%, Dilworth +38%, Plaza Midwood +36%, NoDa +34%, Myers Park +33%, Uptown +29%, Elizabeth +28%. Stable luxury markets (Eastover, Foxcroft) show 18%–24% with lower variance.
- Total annual ROI (cash flow + appreciation) at Charlotte 2026 pricing typically lands 8%–14% on financed rentals and 6%–11% on all-cash. This outperforms most East Coast peer metros (NYC boroughs 3%–6%, Boston 5%–7%, DC 4%–7%) while remaining below high-cap-rate Sun Belt markets like Memphis and Birmingham.
SHORT ANSWER
Charlotte's best 2026 investment ROI neighborhoods depend on investor profile. Plaza Midwood, NoDa, Wesley Heights, and Optimist Park lead for cash flow (cap rates 5.5%–7.8%). South End, Dilworth, and Myers Park lead for appreciation (5-year gains 33%–41%). SouthPark, Elizabeth, and lower-tier Foxcroft lead the hybrid score. Total annual ROI typically lands 8%–14% financed / 6%–11% all-cash — outpacing NYC, Boston, and DC metros.
THE FRAMEWORK: THREE ROI PROFILES
Why One "Best" Neighborhood Doesn't Exist
Cash-flow investors want current income — monthly net cash flow after all expenses. They accept lower appreciation in exchange for reliable yield. Appreciation investors are willing to accept zero or negative monthly cash flow if the neighborhood's medium-term price growth is strong. Hybrid investors want both — a modest cash flow floor plus meaningful appreciation upside. Which you are determines which Charlotte neighborhood you should target. Mixing them leads to buying in the wrong submarket for your actual strategy.
The Three ROI Profiles Defined
| Investor Profile | Target Cap Rate | Target 5-Year Appreciation | Typical Price Band | Tenant Management |
|---|---|---|---|---|
| Cash-Flow | 5.5%–7.8% | 15%–25% | $275K–$650K | Hands-on or active PM |
| Appreciation | 3.5%–4.8% | 30%+ | $650K–$3M+ | Lower turnover, passive |
| Hybrid | 4.8%–5.9% | 24%–31% | $500K–$1.5M | Moderate |
| Luxury / STR | Below 3.5% (LTR equiv) | 18%–28% | $1.5M–$8M | Active operator or concierge PM |
CASH-FLOW NEIGHBORHOODS: THE YIELD LEADERS
Plaza Midwood, NoDa, Wesley Heights, Optimist Park
| Neighborhood | Typical Price | Avg Monthly Rent (SFH) | Cap Rate | Gross Yield | Vacancy Risk |
|---|---|---|---|---|---|
| Plaza Midwood | $525K–$875K | $2,950–$4,200 | 5.8% | 7.6% | Low |
| NoDa | $475K–$750K | $2,700–$3,800 | 5.5% | 7.3% | Low |
| Wesley Heights | $425K–$625K | $2,600–$3,400 | 6.4% | 8.2% | Moderate |
| Optimist Park | $380K–$575K | $2,400–$3,200 | 7.1% | 9.2% | Moderate-High |
| LoSo (Lower South End) | $410K–$625K | $2,500–$3,400 | 6.6% | 8.5% | Moderate |
| Enderly Park | $325K–$485K | $2,100–$2,800 | 7.8% | 9.0% | Higher |
These submarkets share three drivers: walkable density, proximity to Uptown employment (2–4 miles), and ongoing infrastructure investment. NoDa and Plaza Midwood have benefitted from LYNX Blue Line light rail access. Wesley Heights and Optimist Park have benefitted from Camp North End redevelopment spillover. Enderly Park is the highest-yield play but carries meaningfully higher tenant turnover and capital expenditure requirements — suitable only for active operators.
Cash-Flow Risk Factors in 2026
The Charlotte STR ordinance currently requires registration, occupancy limits by zone, and owner-occupancy in certain districts. A further tightening in 2026-2027 is possible and would materially affect pro-forma yields for investors modeling short-term revenue. For long-term rentals, the larger risk is apartment oversupply: multifamily deliveries in 2024-2026 were meaningful, and some submarkets are seeing year-over-year rent flattening. Conservative underwriting uses current rent levels, not projected growth.
Free: Charlotte Investment Property Pro-Forma Template
The same neighborhood-by-neighborhood pro-forma spreadsheet I use with 1031 exchange and buy-and-hold clients. Inputs: price, rent, tax, insurance, vacancy, management, capex. Outputs: cap rate, cash-on-cash, IRR, and 5/10-year total ROI scenarios.
Send Me The Pro-Forma TemplateAPPRECIATION NEIGHBORHOODS: THE GROWTH LEADERS
South End, Dilworth, Myers Park
| Neighborhood | Typical Investment Price | 5-Year Appreciation | Key Driver |
|---|---|---|---|
| South End | $525K–$1.2M condo/$700K–$1.8M SFH | +41% | Light rail, corporate relocation density |
| Dilworth | $850K–$2.0M | +38% | Historic housing stock scarcity |
| Plaza Midwood | $525K–$875K | +36% | Walkable urbanism, tenant demand |
| NoDa | $475K–$750K | +34% | Arts district, light rail |
| Myers Park | $1.8M–$6M | +33% | Trophy-lot scarcity, school catchment |
| Uptown (condos) | $450K–$1.4M | +29% | Corporate HQ density |
| Elizabeth | $700K–$1.6M | +28% | Historic character, walkability |
Appreciation-focused investors often accept negative monthly cash flow for 12–36 months in exchange for the medium-term capital gain. This only makes sense if the investor has other income supporting the carry, if the property type has low cap-ex risk, and if the holding horizon is 5+ years. Short-horizon appreciation plays are speculation, not investment.
Why Light Rail and Infrastructure Matter
The Blue Line extension opened in 2018 and has had the most measurable effect on property values in NoDa, South End, and University City corridors. The Silver Line is earlier-stage but its planned route creates a set of 2026-2030 investment theses — neighborhoods in the planned corridor should see appreciation premium as construction advances. This is a long-dated thesis (5–10 year horizon) and carries execution risk.
CHARLOTTE INVESTMENT ROI CALCULATOR
Enter a target Charlotte purchase price and neighborhood category to see projected annual ROI (cash flow + appreciation) under three leverage scenarios: All-Cash, 25% Down, and 40% Down. Uses current cap rate and appreciation data by neighborhood tier.
Projected Annual Total ROI (All-Cash)
$0
Projected Annual Total ROI (25% Down, 75% Financed @ 6.1%)
$0
Note: This calculator uses current cap rate and appreciation data for each Charlotte neighborhood category. Financed scenario uses 75% LTV at 6.1% (consensus 2026 30-year rate), annual debt service approximated at 7.28% of principal. Actual returns depend on property-specific factors, vacancy, capex, and management approach. For a personalized pro-forma, schedule a 30-minute call.
HYBRID NEIGHBORHOODS: THE BALANCED PLAYS
SouthPark, Elizabeth, Lower-Tier Foxcroft
| Neighborhood | Typical Investment Price | Cap Rate | 5-Yr Appreciation | Combined Score |
|---|---|---|---|---|
| SouthPark | $900K–$2.5M | 4.8% | 26% | Balanced |
| Elizabeth | $700K–$1.6M | 5.1% | 28% | Balanced-Appreciation |
| Lower-Tier Foxcroft | $1.0M–$1.5M | 4.9% | 24% | Balanced |
| Cotswold | $650K–$1.2M | 5.4% | 22% | Cash-Balanced |
| Montford | $550K–$950K | 5.7% | 25% | Cash-Balanced |
| Sedgefield | $525K–$875K | 5.9% | 27% | Cash-Balanced |
Hybrid neighborhoods appeal to investors who want fewer total assets in the portfolio but strong combined performance per asset. They also tend to attract higher-credit-quality tenants (executives, medical professionals) which reduces turnover and capex risk. The tradeoff versus pure cash-flow plays: lower monthly net income per dollar invested. The tradeoff versus pure appreciation plays: less sensitivity to any single neighborhood's growth thesis.
LUXURY AND SHORT-TERM RENTAL STRATEGIES
Lake Norman Waterfront as an STR Luxury Play
The Lake Norman STR model works because of weekend demand from Charlotte professionals, corporate retreat bookings, and wedding / event hosting revenue. It does not work as a pure passive investment — successful operators either actively manage or hire a concierge property management firm (typical fee: 22–35% of gross revenue) that handles turnover, maintenance, and guest experience. Pro-forma underwriting should assume 15% gross-to-net friction beyond PM fees for utilities, cleaning supplies, maintenance, and vacancy.
Urban STR: Uptown, Plaza Midwood, South End
Before modeling STR revenue on any Charlotte investment property, verify the zoning district allows non-owner-occupied STRs. The ordinance distinguishes between whole-home rentals, owner-occupied rentals, and primary-residence hosts, with different rules for each. Some HOAs and condo boards have additional restrictions that supersede city rules. For a deep dive on specific submarket rules, see our International Buyer's Guide, which covers STR investment structures used by foreign principals.
1031 EXCHANGE AND TAX CONSIDERATIONS
Why Charlotte Works Well for 1031 Exchanges
The 1031 mechanics are IRS-standard — 45 days to identify, 180 days to close, like-kind requirements, qualified intermediary. The Charlotte-specific advantage is the combination of cap rate arbitrage and tax arbitrage. An NYC investor selling a $1.2M rental at a 3.8% cap and redeploying into Charlotte at 5.8% immediately increases NOI by approximately $24,000/year, and NC's 3.99% flat tax (versus NY 10.9%) adds another 6.9 points of after-tax retention. For specific 1031 planning, consult a qualified intermediary and your CPA — this article is informational, not tax advice.
Property Tax and Ownership Cost
For a more complete cost-of-ownership breakdown for Charlotte investors including insurance, HOA fees, and capex planning, see our Charlotte Cost of Living 2026 Guide. Property tax is typically the largest fixed holding cost after mortgage on a Charlotte rental, and its competitiveness versus alternative investment markets is part of why Charlotte's all-in cap rate story is stronger than its headline rental yield suggests.
HONEST RISKS AND OBJECTIONS
Risk #1: Multifamily Supply Pressure on Rents
The multifamily pipeline is expected to moderate in 2027-2028 as construction starts have fallen, which should restore rent growth. But in the near term, second-tier submarkets dependent on class-B apartment tenants may see yield compression. Underwriting to current rents avoids this trap. If the neighborhood's gross yield looks too good to be true at asking price, check the pipeline of nearby apartment deliveries before offering.
Risk #2: Short-Term Rental Regulation Tightening
If your investment thesis only works with STR revenue and collapses under LTR pro-forma, the investment is too concentrated in regulatory risk. Best practice: buy properties that work as LTRs, then capture STR premium as an upside. Lake Norman waterfront is the one exception where the lake-frontage premium is more durable than general urban STR — but even there, HOA-level restrictions vary by community.
Risk #3: Rising Insurance and Property Tax
Insurance and tax creep erode cap rates over time if rents do not keep pace. Conservative underwriting uses 5-year inflation assumptions for both line items, stress-tested against a scenario where rent growth lags inflation by 1–2 percentage points. This is how you avoid owning an asset that generates healthy yield at purchase but breaks even or loses money by year 5.
DECISION FRAMEWORK: WHICH PROFILE FITS YOU
CHOOSE CASH-FLOW IF
- Your portfolio goal is to replace or supplement W-2 income with monthly net cash flow
- You're an active operator willing to handle tenants, turnover, and capex directly or via close oversight of a PM
- Price band is $275K–$650K and you want to acquire multiple doors over 2–3 years
- Target: Plaza Midwood, NoDa, Wesley Heights, Optimist Park, LoSo
CHOOSE APPRECIATION IF
- You have other income supporting negative or break-even carry for 12–36 months
- Your horizon is 5+ years and you want large compounded capital gains
- You prefer passive ownership, low tenant turnover, and appreciation of quality assets
- Target: South End, Dilworth, Myers Park, Eastover, top-tier Foxcroft
CHOOSE HYBRID IF
- You want one or two quality assets rather than many smaller ones
- Your price band is $500K–$1.5M and you want meaningful cash flow PLUS appreciation
- You prefer higher-credit-quality tenants with longer average tenancy
- Target: SouthPark, Elizabeth, lower-tier Foxcroft, Cotswold, Montford
FREQUENTLY ASKED QUESTIONS
What are the best Charlotte neighborhoods for investment ROI in 2026?
Charlotte's top investment neighborhoods split by investor profile. For cash-flow focused investors, Plaza Midwood, NoDa, Wesley Heights, and Optimist Park lead with gross rental yields of 6.8%–9.2% and cap rates of 5.5%–7.8%. For appreciation-focused investors, South End, Dilworth, and Myers Park lead with 5-year appreciation of 32%–41%. For hybrid (balanced) investors, SouthPark, Elizabeth, and lower-tier Foxcroft deliver the best combined score with 4.8%–5.9% cap rates and 24%–31% 5-year appreciation. Lake Norman waterfront is the top luxury-tier investment play with strong appreciation and premium short-term rental yields.
What is a good cap rate for a Charlotte rental property in 2026?
A good cap rate in Charlotte 2026 depends on submarket and risk profile. In emerging urban neighborhoods (Optimist Park, Wesley Heights, LoSo), 6.5%–7.8% is achievable but carries higher vacancy and capex risk. In established urban neighborhoods (Plaza Midwood, NoDa, Dilworth), 5.0%–6.5% is typical with more stable tenant demand. In luxury neighborhoods (Myers Park, Eastover, SouthPark), 3.5%–4.8% is normal — investors are paying for capital appreciation, not yield. Below 3.5% typically indicates the property should be held as a trophy asset or short-term rental, not a traditional long-term rental.
Which Charlotte neighborhoods have the highest appreciation rates?
The highest 5-year appreciation rates in Charlotte through April 2026 are concentrated in South End (+41% — driven by light rail expansion and corporate relocation), Dilworth (+38% — historic housing stock scarcity), Plaza Midwood (+36%), NoDa (+34%), and Myers Park (+33%). Emerging neighborhoods like Optimist Park, LoSo, and Camp North End area show higher percentage gains from lower price bases but with more volatility. Stable luxury neighborhoods (Eastover, Foxcroft) show steady 18%–24% 5-year appreciation with lower variance — the right choice for investors who prioritize predictability over maximum growth rate.
Should I invest in short-term rentals or long-term rentals in Charlotte?
In Charlotte 2026, the short-term vs long-term rental decision is neighborhood-specific. Short-term rentals (Airbnb/VRBO) can deliver 1.5x–2.2x the gross yield of long-term rentals in South End, Plaza Midwood, Uptown, and NoDa — but Charlotte's STR ordinance requires registration, owner-occupancy for certain zones, and imposes operational limits. Lake Norman waterfront delivers the strongest STR premium with weekly rates of $4,500–$12,000 in peak season. For hands-off investors, long-term rentals in established neighborhoods remain the lower-variance path. Best practice: buy properties that work as LTRs so STR revenue is upside, not the thesis.
How much cash flow can I expect from a $500K Charlotte rental property?
A $500,000 Charlotte rental property in 2026 typically generates $2,500–$3,800/month in gross rent — $30,000–$45,600 annually. After mortgage P&I (financed at 6.1% on 75% LTV = $2,273/month), property tax ($3,834/yr), insurance ($1,800/yr), vacancy allowance (5%), maintenance (1% of property value = $5,000/yr), and management (8% if outsourced), typical net cash flow lands at $200–$800/month for financed properties, or $1,400–$2,200/month for all-cash purchases. Total ROI including appreciation typically lands at 8%–14% annually depending on neighborhood selection. See the Cash vs Jumbo Financing guide for the after-tax cost-of-capital math on financed acquisitions.
Does Charlotte work for 1031 exchange investors?
Yes — Charlotte is one of the top 1031 exchange replacement markets in the Southeast. The combination of higher cap rates than coastal metros (2–3 points of improvement for NYC/SF/LA investors), North Carolina's 3.99% flat income tax on rental income versus 10.9%–13.3% in the exit states, and deep inventory across multiple price bands makes the 45-day identification window achievable. A $1.2M NYC rental at a 3.8% cap redeployed to Charlotte at 5.8% immediately adds $24,000 in annual NOI. Always consult a qualified intermediary and your CPA for specific 1031 planning — this guide is informational, not tax advice.
EXPLORE RELATED RESOURCES
Charlotte Luxury Market Forecast 2026-2027
The honest, mixed-signal market forecast for Charlotte luxury real estate — essential context for investment timing decisions.
Cash vs Jumbo Financing at $2M+
The after-tax cost-of-capital math, leverage framework, and Delayed Financing Exception strategy for Charlotte luxury investors.
Best Luxury Neighborhoods in Charlotte
The complete neighborhood guide — architecture, schools, amenities, and buyer profiles for each Charlotte luxury submarket.
WHAT'S NEXT
- If you're starting: Identify your profile first — cash-flow, appreciation, or hybrid. Match your profile to the right submarket before touring anything. Most first-time investor mistakes are submarket-profile mismatches.
- If you're scaling a portfolio: Spread across 2–3 neighborhoods to reduce single-submarket concentration risk. Stress-test every pro-forma against STR regulation tightening and multifamily supply.
- If you're a 1031 investor: Start the Charlotte identification process 60–90 days before your exit closing, not after. The 45-day window is tight if you begin late.
- If you're considering Lake Norman STR: Interview 2–3 concierge PMs before offering. Operating capability is as important as the property itself for luxury STR economics.
- Ready to underwrite specific properties? Schedule a 30-minute strategy call and I'll walk through your target submarkets with the current cap rate, rent, and appreciation data — plus off-market inventory when available.
Investment Property Briefing
The quarterly Charlotte investment briefing — submarket cap rates, rent trends, STR regulation updates, and 1031 replacement inventory. Used by buy-and-hold investors, 1031 exchanges, and luxury STR operators.
Delivered quarterly. No spam.
30-Minute Strategy Call
Work directly with Mitch Boraski, MBA — founder of L ISTRE Group. Data-driven investment property analysis, submarket-level cap rate and appreciation data, 1031 replacement sourcing, and off-market access for Charlotte investors.
★★★★★ — 4.9/5 across 87 reviews.
REFERENCES
- Canopy MLS / Carolina Multiple Listing Services market reports, 2026 Q1 — carolinamls.com
- City of Charlotte Short-Term Rental Ordinance — charlottenc.gov
- Mecklenburg County Tax Assessor property tax rate schedule 2026 — mecknc.gov
- North Carolina Department of Revenue individual income tax rates — ncdor.gov
- AirDNA Charlotte short-term rental market data — airdna.co
- Zillow Home Value Index and Rental Index, Charlotte NC submarkets — zillow.com/research
- Redfin Housing Market Data, Charlotte submarket analytics — redfin.com/news/data-center
- IRS Section 1031 Like-Kind Exchanges — irs.gov

Author
Boraski, MBA