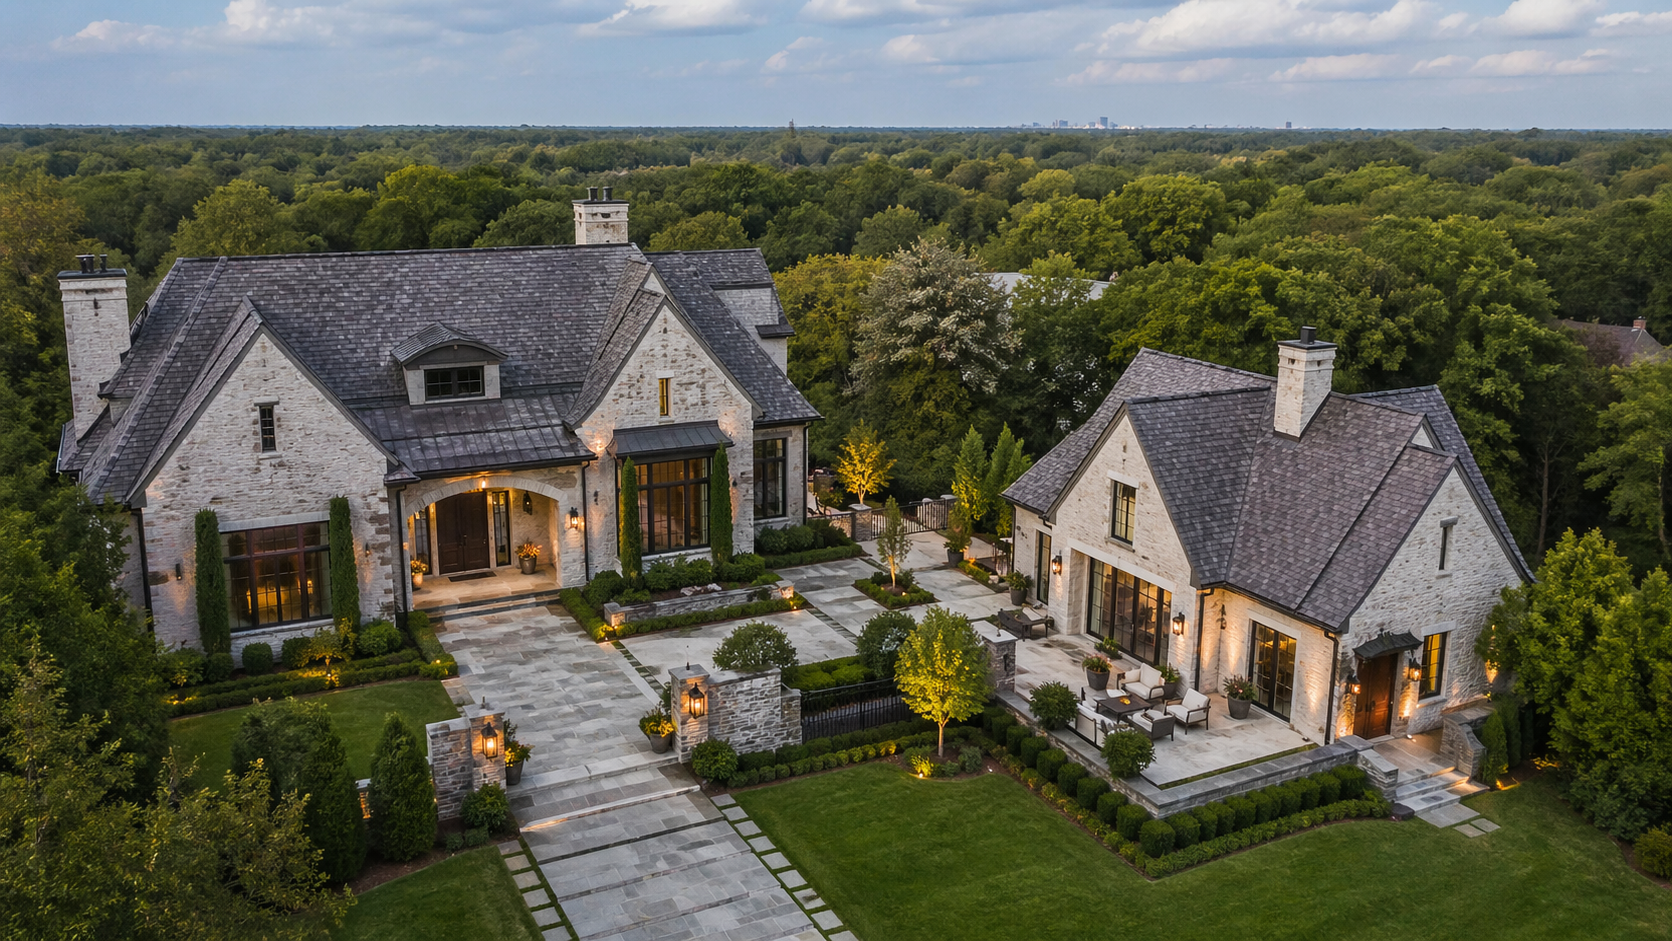
Charlotte Luxury Market Forecast 2026–2027: What's Next
Last updated: April 14, 2026
EXECUTIVE SUMMARY
- Charlotte's 2026-2027 forecast is mixed. Zillow projects -2.3% for broader Charlotte home values; Redfin and Realtor.com project +1.1% to +1.2% growth. Treat this as a flat-to-modestly-positive market, not a boom.
- The luxury segment is bifurcating. Price-per-square-foot for $1M+ homes is up 3.7% year-over-year, while the median luxury closing price has softened 5.3% — reflecting mix shift, not weakness in trophy inventory.
- Mortgage rates stay above 6%. Wells Fargo projects 6.14% (2026) / 6.19% (2027); NAHB projects 5.99% / 5.89%; MBA baseline is rates won't dip below 6%. Plan around the new baseline, not a return to 2021 conditions.
- Buyers have their strongest leverage in five years. Inventory is up 27.2% YoY, days-on-market extended from 54 to 88, and sellers are accepting contingencies, credits, and rate buy-downs. Myers Park and Eastover trophy homes remain competitive (30-day median DOM) but second-tier luxury has shifted.
- Demand floor is structurally strong. Charlotte metro is the 7th-fastest-growing U.S. metro, adding 157 residents/day — 278,700 since 2020. Second-largest U.S. banking center with continuing executive relocation. This underpins the floor but does not prevent cyclical inventory resets.
SHORT ANSWER
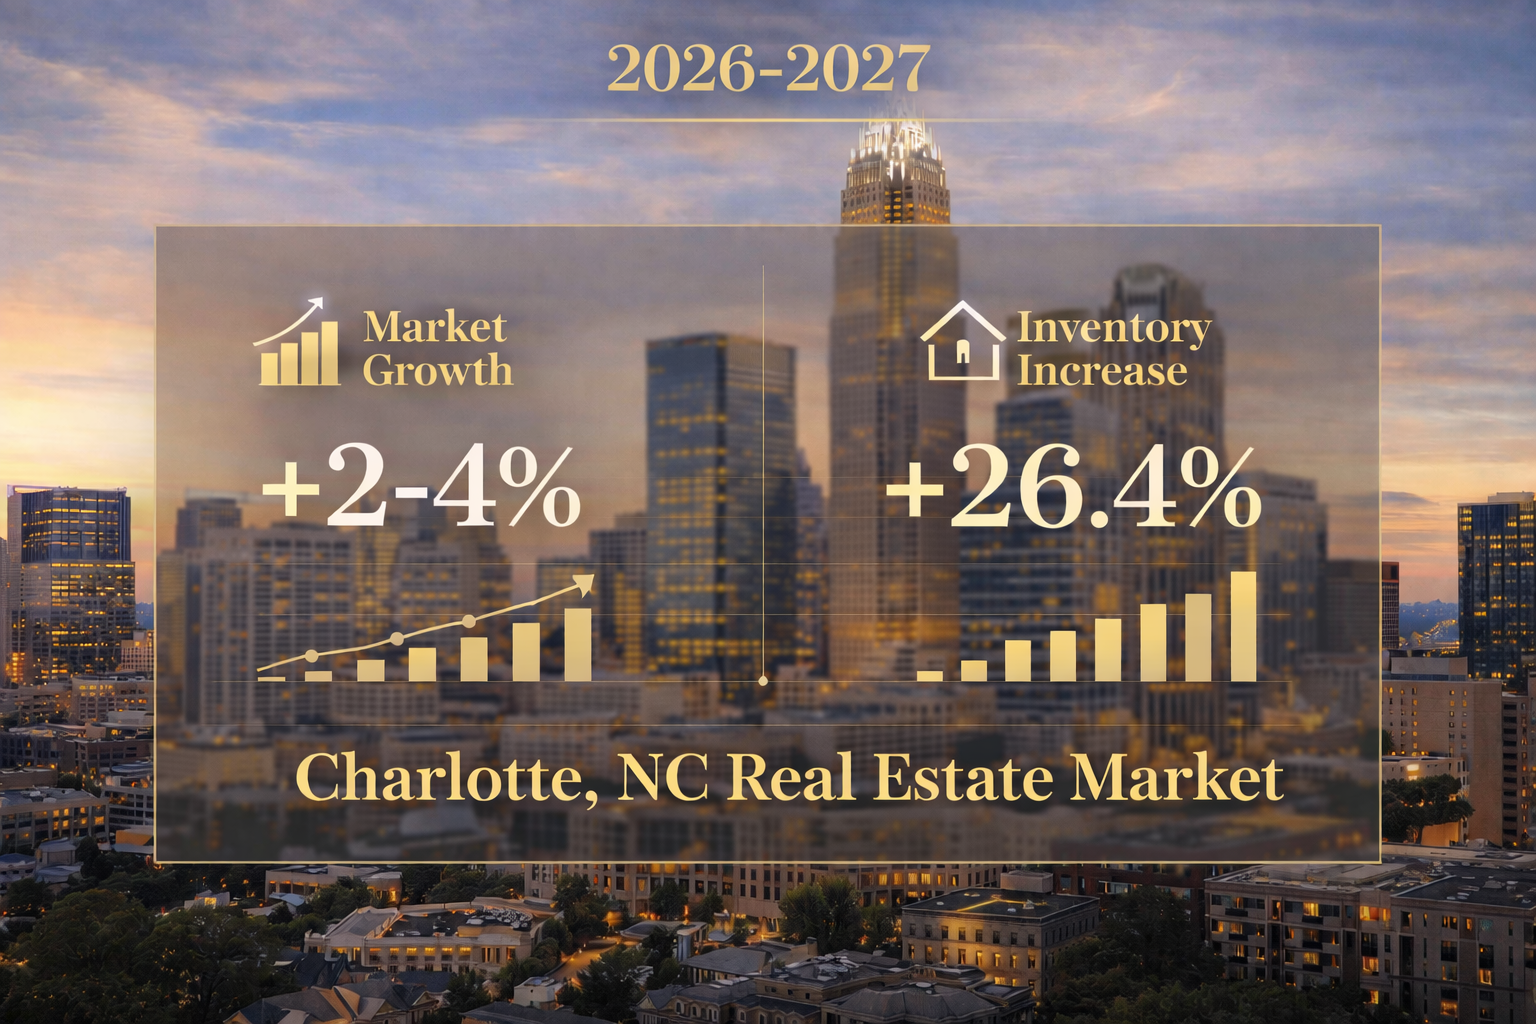
Charlotte's 2026-2027 luxury real estate forecast is flat-to-modestly-positive with a bifurcated segment. Zillow projects -2.3% for broader home values; Redfin and Realtor.com project +1.1% to +1.2%. The luxury tier decouples from this: price-per-square-foot up 3.7% even as the aggregate median softens on mix shift. Mortgage rates hold 5.89%-6.19% through 2027. Inventory is up 27.2% and days-on-market has extended to 88 — the strongest buyer leverage environment since 2020.
THE MIXED-SIGNAL DATA: WHAT THE MAJOR FORECASTERS ACTUALLY SAY
The Forecast Spread for Charlotte 2026-2027
| Source | 2026-2027 Price Forecast | Notes |
|---|---|---|
| Zillow | -2.3% YoY | Median value ~$387K; reflects broader metro, not luxury segment |
| Redfin | +1.2% YoY | Median ~$415K; based on closing data through Q1 2026 |
| Realtor.com | +1.1% prices / -2.4% sales | Charlotte ranked #70 nationally for 2026 growth |
| NAR (consensus) | +3.5% to +4.8% | National figure; regional variation expected |
| CoreLogic | +2.0% to +3.0% | Sun Belt metro consensus |
Why the spread? Each forecaster weights different inputs. Zillow's model is sensitive to inventory expansion and the 88-day DOM — it reads 2026 as cooling. Redfin and Realtor.com weight population migration and corporate relocation more heavily — they read 2026 as resilient. The honest answer is that both are partly right : the broader metro is cooling, while targeted luxury submarkets with fundamental demand continue to hold.
Mortgage Rate Forecasts: The 6% Floor
| Forecaster | 2026 30-Yr Rate | 2027 30-Yr Rate |
|---|---|---|
| Wells Fargo | 6.14% | 6.19% |
| NAHB | 5.99% | 5.89% |
| Mortgage Bankers Association | 6.2%-6.5% | 6.0%-6.3% |
| Fannie Mae | 6.0%-6.2% | 5.8%-6.0% |
| Consensus Midpoint | ~6.1% | ~6.0% |
For luxury buyers considering financing vs cash, this stabilized rate environment has an important implication: rate volatility risk is low through the forecast period. If you're deploying a jumbo financing strategy vs all-cash, the downside case (rates spike further) has receded. The upside case (rates drop materially) has also receded. This is a planning-friendly environment even if it isn't the "rates will drop" environment buyers hoped for in 2023-2024.
THE LUXURY SEGMENT IS DECOUPLING
The Bifurcation Inside the Luxury Tier
The apparent contradiction resolves when you look at how the numbers are produced. The "luxury median" is a simple midpoint of all $1M+ closings in a period. When more $1.2M-$1.5M closings happen in a given quarter (which is what happened in 2025-2026), the median drops even if every trophy home above $3M is selling at or above prior comps. Price-per-square-foot normalizes for this — and at +3.7% it tells a very different story.
| Neighborhood | 2026 Average Home Price | Median DOM | YoY Direction (Trophy Tier) |
|---|---|---|---|
| Eastover | $2.86M | 30-45 days | +3% to +5% |
| Myers Park | $2.5M | 30 days | +2% to +4% |
| Quail Hollow | $2.5M | 35-50 days | +2% to +4% |
| Foxcroft | $2.2M | 45-60 days | Flat to +2% |
| SouthPark (luxury) | $1.4M-$2.5M | 55-75 days | Flat |
| Lake Norman(Waterfront) | $2.5M-$8M+ | 60-90 days | Flat to +3% (top tier) |
| Ballantyne (luxury) | $1.0M-$2.0M | 75-110 days | -1% to -3% |
For deeper context on each submarket, see our Best Luxury Neighborhoods in Charlotte guide and the 2026 Charlotte Luxury Buyer's Guide.
Free: Charlotte Luxury Market Quarterly Briefing
The same segment-level data I use with private clients — neighborhood-by-neighborhood pricing, DOM, and inventory trends for the $1M+ Charlotte market. Delivered quarterly. Used by relocating executives, 1031 investors, and second-home buyers to avoid top-line-headline mistakes.
Send Me The BriefingLUXURY HOME VALUE SCENARIO CALCULATOR
Enter a target Charlotte luxury purchase price and see projected 2027 and 2028 values across three evidence-based forecast scenarios: Bearish (Zillow-weighted), Base (consensus midpoint), and Bullish (Redfin + migration-weighted). The calculator reflects Charlotte luxury price-per-square-foot trends, not broader metro averages.
Projected Value 2027 (Year 1)
$0
Projected Value 2028 (Year 2)
$0
Note: This calculator uses annualized compound growth rates derived from current forecaster data. Scenario rates are: Bearish -2.3% (Zillow-weighted), Soft -0.5% (luxury median aggregate), Base +1.5% (consensus midpoint), Luxury $/sqft +3.7% (trophy tier), Bullish +5.0% (migration + corporate relocation weighted). Actual outcomes depend on neighborhood, property quality, and broader macro conditions. For a personalized segment forecast on your specific submarket, schedule a 30-minute call.
BUYER LEVERAGE: THE STRONGEST POSITION IN FIVE YEARS
The Inventory and DOM Shift
The shift is not uniform across the luxury market. Trophy inventory in Myers Park continues to trade at a 30-day median DOM — still a seller-favorable segment. Eastover top-tier homes clear in 30-45 days. But the second-tier luxury band ($1M-$2M), particularly in Ballantyne and suburban new construction, has extended to 75-110 days, with 8-12% average list-to-sale price reductions becoming common. For relocating executives and international buyers, this is a structurally better entry environment than 2021-2023.
What Sellers Are Actually Accepting in 2026
At the trophy tier ($3M+), the picture is more nuanced. Truly irreplaceable Eastover or Myers Park lots still trade at or near asking, often with competing offers. But even here, 2026 buyers are securing longer due-diligence periods (14-21 days vs 5-7 days in 2022) and more seller flexibility on possession dates. The leverage shift is real — it's just calibrated to property quality and competing demand, not absolute.
DEMAND DRIVERS: WHY THE FLOOR IS STRUCTURAL
Population Growth and Migration
Where Charlotte's growth matters for the luxury segment specifically: the executive cohort. Charlotte is the second-largest U.S. banking center after New York, with Bank of America, Truist, Wells Fargo's East Coast hub, and dozens of regional and super-regional institutions. Continued corporate relocation, particularly from higher-cost coastal metros, keeps the $1M-$3M executive home segment fundamentally supported. This is what "structural floor" means in practice — not that prices always rise, but that demand does not collapse in cyclical downturns.
Corporate and Banking Hub Status
For international buyers evaluating Charlotte as a U.S. entry point, the combination of banking-hub credibility, lower cost-of-living than coastal alternatives, and continued corporate-HQ growth is a distinctive value proposition. Our International Buyer's Guide covers FIRPTA, cash-buyer leverage, and the LLC title structure commonly used by foreign principals.
HONEST OBJECTIONS AND RISK FACTORS
Risk #1: Rate Environment Stays Elevated Longer
This is the scenario most luxury buyers under-weight. The 2023-2024 consensus was that rates would meaningfully drop by 2026, unlocking pent-up demand. That has not happened. If it continues not to happen, the buyer leverage advantage persists — which is good for buyers but delays the appreciation case for owners. Plan for the rate environment you have, not the one you want.
Risk #2: New-Construction Luxury Oversupply
The implication for buyers: avoid paying trophy-tier prices for second-tier inventory. The implication for sellers in this segment: realistic pricing and aggressive concessions (rate buy-downs, included upgrades) are the path to closing. This is where the aggregate luxury median decline (-5.3%) is concentrated.
Risk #3: National Recession Scenario
The Charlotte-specific risk is that a banking-sector downturn would hit the executive cohort harder than a generic recession. That's a real but unpredictable tail risk. The base case remains flat-to-modestly-positive.
DECISION FRAMEWORK: BUY, WAIT, OR SELL
BUY NOW IF
- Target is trophy-tier Eastover, Myers Park, Quail Hollow, or top-tier Foxcroft — inventory is thin and the best properties still command premium
- You're a qualified cash or jumbo-ready buyer seeking second-tier luxury — concessions and rate buy-downs are abundant
- Relocating with corporate timeline (start date, school year) that makes waiting costlier than marginal price risk
- Planning to hold 7+ years — short-term price noise is less relevant than long-term Charlotte migration fundamentals
WAIT IF
- Flexible on timing and targeting generic new-construction $1M-$2M — oversupply is likely to extend further
- Planning to finance at maximum stretch — wait for rate clarity or build additional down payment
- Considering Ballantyne / suburban luxury where DOM is extending and list-to-sale reductions are accelerating
- Need to sell current home first in a contingent market — timing complexity may outweigh price opportunity
SELL NOW IF
- Own second-tier luxury (Ballantyne, suburban new builds, generic $1M-$2M) — competing supply will only grow
- Have owned 5+ years and have substantial embedded equity — can absorb concessions and still net strong
- Lifecycle event (downsize, relocation, inheritance) makes timing the market secondary to execution
- Trophy inventory — top of market still clearing quickly; no reason to wait for incremental lift
FREQUENTLY ASKED QUESTIONS
What is the Charlotte real estate market forecast for 2026-2027?
Charlotte's 2026-2027 forecast shows mixed signals across major forecasters. Zillow projects -2.3% for broader home values; Redfin and Realtor.com project +1.1% to +1.2% growth. The luxury segment ($1M+) is decoupling: price-per-square-foot is up 3.7% YoY even as the aggregate luxury median has softened 5.3% on mix shift. Mortgage rates are forecast at 5.89%-6.19% through 2027. Inventory is up 27.2% and days-on-market has extended from 54 to 88 days — the strongest buyer leverage environment in five years. The honest net picture: flat-to-modestly-positive for the luxury segment overall, with trophy inventory outperforming second-tier.
Will Charlotte luxury home prices go up or down in 2026-2027?
The Charlotte luxury segment is bifurcating. Trophy inventory in Eastover, Myers Park, Quail Hollow, and top-tier Foxcroft — architecturally significant homes on premium lots — is holding or appreciating modestly (2-5% expected in 2026-2027). Second-tier luxury ($1M-$2M generic suburban builds) is flat to softening (-1% to -3% expected). Lake Norman trophy waterfront is positive; Lake Norman mid-tier is flat. The aggregate number you see in headlines obscures this bifurcation — which is why the headline "luxury is down 5.3%" and "luxury $/sqft is up 3.7%" are both true simultaneously.
What are mortgage rates expected to be in Charlotte for 2026-2027?
Major forecasters converge on 30-year mortgage rates in the 5.89%-6.19% range through 2027. Wells Fargo projects 6.14% (2026) and 6.19% (2027). NAHB projects 5.99% (2026) and 5.89% (2027). The Mortgage Bankers Association's baseline is that rates remain above 6% through the forecast period. Fannie Mae's forecast aligns with consensus in the 5.8%-6.2% band. This stabilized rate environment is materially different from the sub-3% era of 2020-2021 and should be planned around as the new baseline. For luxury buyers weighing cash versus jumbo financing, the low rate-volatility environment is actually planning-friendly even if it isn't the "rates will drop" environment many hoped for.
Is now a good time to buy luxury real estate in Charlotte?
For qualified luxury buyers, the 2026 Charlotte market offers meaningfully more leverage than 2021-2023. Inventory is up 27.2% year-over-year, days-on-market has extended from 54 to 88 days citywide, and sellers in the second-tier luxury band are accepting pre-offer contingencies (40% of deals), appraisal gap caps (60%), rate buy-down contributions of $15K-$40K (35%), and closing cost credits. Myers Park and Eastover trophy homes remain competitive (30-day median DOM) but the negotiating power on suburban and new-construction luxury has shifted firmly to buyers. Cash and jumbo-qualified buyers have the strongest position they've had in five years — but property selection matters more than it did in the bidding-war era, because not everything will appreciate.
Which Charlotte neighborhoods are forecast to appreciate most in 2026-2027?
Trophy inventory in Eastover, Myers Park, and Quail Hollow has the strongest appreciation outlook — driven by persistent demand, constrained supply of premium lots, and architectural significance that cannot be replicated by new construction. Top-tier Foxcroft is flat to +2%. Lake Norman waterfront at the $3M+ tier is flat to +3%, though mid-tier Lake Norman is softer. Dilworth and Myers Park historic homes with distinctive architecture also continue to hold value. The weakest forecast areas are new-construction $1M-$2M Ballantyne and suburban luxury new builds — interchangeable inventory facing continued supply expansion.
How does Charlotte population growth affect the luxury market?
Charlotte metro is the 7th-fastest-growing large U.S. metropolitan area, adding roughly 157 residents per day — 278,700 since 2020. For 2024-2025, net migration was 24,400 domestic and 18,240 international. For the luxury market specifically, the relevant cohort is high-income executive relocation driven by Charlotte's status as the second-largest U.S. banking center, continued corporate HQ expansions, and cost-of-living advantages versus coastal metros. This demand underpins a structural floor under luxury prices. It does not eliminate normal inventory cycles — 2026's buyer-favorable conditions are cyclical, not a sign of structural weakness.
EXPLORE RELATED RESOURCES
2026 Charlotte Luxury Buyer's Guide
The complete Charlotte luxury acquisition playbook: neighborhoods, school districts, financing, and off-market access.
Cash vs Jumbo Financing at $2M+
The cost-of-capital math, seller-leverage implications, and Delayed Financing Exception strategy for Charlotte luxury buyers.
Cost of Living in Charlotte NC 2026
The household-economics delta for executives relocating from NY, SF, LA, or Boston — with private school and luxury tier factored in.
WHAT'S NEXT
- If you're buying: Before making an offer, request a segment-level comparable analysis for your target submarket. "Luxury is up" or "luxury is down" hides the bifurcation. The Luxury Market Briefing gives you the underlying data.
- If you're selling: Stage your listing strategy around which tier you own. Trophy-tier pricing and positioning is different from second-tier — the same "price it aggressively, marketing premium" playbook doesn't work in both.
- If you're relocating: Combine this forecast with the Cost of Living guide and the Neighborhood Guide to set a realistic purchase budget by submarket.
- If you're weighing cash vs financing: The stabilized rate environment changes the math. The Cash vs Jumbo Financing guide shows the after-tax cost-of-capital analysis.
- Ready to act? Schedule a 30-minute strategy call and I'll walk through your specific submarket, price band, and timing scenario using the same segment-level data that appears in this forecast.
Luxury Market Briefing
The quarterly segment-level data briefing — neighborhood-by-neighborhood pricing, DOM, and inventory for Charlotte luxury. Used by relocating executives, 1031 investors, and second-home buyers.
Delivered quarterly. No spam.
30-Minute Strategy Call
Work directly with Mitch Boraski, MBA — founder of L ISTRE Group. Data-driven luxury acquisition strategy, segment-level market analytics, and discreet off-market access for $2M+ Charlotte buyers.
★★★★★ — 5/5 across 58 reviews.
REFERENCES
- Zillow Home Value Index and 2026-2027 Forecast, Zillow Research — zillow.com/research
- Redfin Housing Market Data, Charlotte Metro, 2026 Q1 — redfin.com/news/data-center
- Realtor.com 2026 Housing Market Forecast — realtor.com/research
- Wells Fargo Economics Monthly Economic Outlook, 2026 — wellsfargo.com
- NAHB Eye on the Economy, Housing Forecast 2026-2027 — nahb.org
- Mortgage Bankers Association Mortgage Finance Forecast — mba.org/news-and-research
- U.S. Census Bureau Metropolitan and Micropolitan Statistical Area Estimates — census.gov
- Canopy MLS / Carolina Multiple Listing Services market reports — carolinamls.com

Author
Boraski, MBA